-
Register for the AgCountry Farm Credit Services Annual Meeting on July 7.

Request Your Policy Review
Connect with one of our crop insurance experts and review your best coverage options using your numbers with our proprietary software.
Would you like to hear from one of our insurance officers? We serve producers in Minnesota, North Dakota and Wisconsin. Fill out the information and we’ll reach out.
Solving for Your Goals
Every farm is different, and farmers’ goals are different. We can ask our proprietary tool to analyze federal insurance policies to find the best choice whatever your risk management goal. For instance:
Highest net indemnity over time.
Best cash flow over time.
The most bushels to forward market.
The most subsidy dollars.

Reviewing Your Options
Behind the calculations are thousands of data points for commodity prices, yields, volatility, etc. Customer data are used to generate customized solutions; county data are used for demonstration purposes for producers in Mnnesota, North Dakota and Wisconsin.
What comes out is a matrix that shows options to keep you in the green, out of the red - based on your actual numbers and goals. A producer can see best choices, as well as which selections might put him in the red.
One of our customers looked at the chart of his yields vs. the county and immediately saw the result of each of the cropping improvements he had made during the past 10 years, validating his production changes.
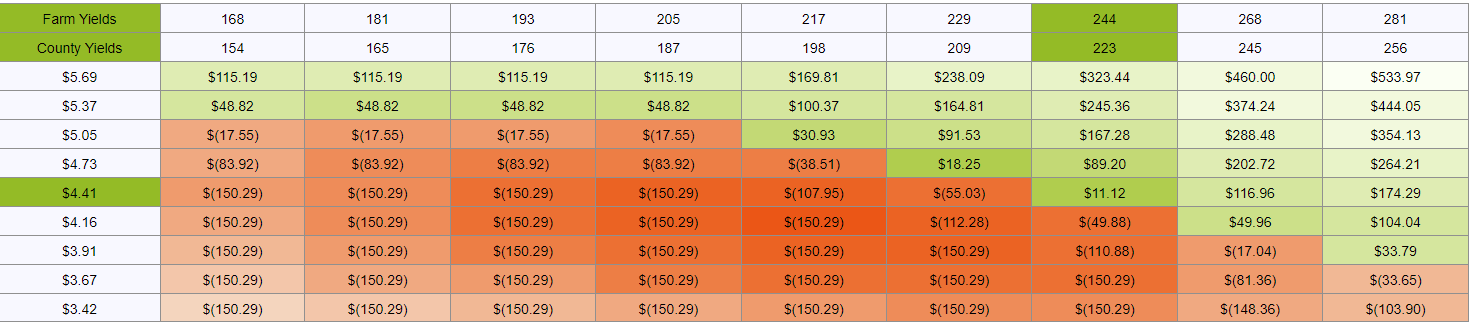
Our software also shows where your current crop insurance plan ranks among all of the selections, showing how on-track or off-track you've been. In the matrix above, the producer had been choosing a specific insurance option when 100 other options were deemed to be more effective for his farm.